
Project Dashboard Setup: Key Metrics to Track and Build
Learn how to set up a project dashboard, what key metrics to track, and how to build one that suits your team's needs with Project Dashboard Setup best practices.
Introduction
Project Dashboard Setup has become essential infrastructure for teams managing complex workflows, budgets, and deliverables. A project dashboard is a visual representation of key metrics and data points that help teams track progress and performance. Without a centralized view of project health, managers resort to spreadsheet archaeology and endless status meetings—both of which delay decisions and obscure problems until they metastasize.
The difference between a dashboard that gets checked daily and one that collects digital dust comes down to three factors: relevance, clarity, and trust. Relevance means showing metrics that actually influence decisions. Clarity means presenting those metrics in a format that requires no translation or second-guessing. Trust means the data updates reliably enough that stakeholders stop maintaining shadow spreadsheets as backup.
Modern dashboard platforms offer varying levels of automation and customization. Some systems allow you to create and manage visual displays from a central interface with no code required, while more advanced implementations use APIs to automate how data flows in and gets reconciled. The right approach depends on your team's technical capacity, the volume of data you're tracking, and how frequently those metrics change. For teams managing workflow automation, dashboard integration often determines whether automation actually reduces workload or just moves it around.
The following sections break down common dashboard setup challenges, walk through a practical implementation framework, and provide specific techniques for maintaining dashboard relevance as projects evolve. Whether you're building your first project dashboard or overhauling an existing one that nobody uses, the principles remain consistent: surface what matters, hide what doesn't, and make the truth impossible to ignore.
Problem Statement
Without a unified project dashboard, teams operate in fragmented silos where critical information lives in email threads, spreadsheets, and memory. Managers chase updates manually, technicians report progress inconsistently, and decision-makers lack real-time visibility into whether projects are on track or bleeding margin. The result: reactive firefighting replaces proactive management, and profit leaks through cracks no one can see until the invoice arrives.
Hidden Labor Costs and Resource Blind Spots
When technician and crew time isn't captured systematically, labor costs become guesswork. Hours worked, tasks completed, and materials consumed disappear into handwritten notes or never get logged at all. Without automated time tracking, managers can't identify inefficiencies, compare crew productivity, or allocate resources based on actual performance data. Projects that should be profitable turn marginal because the true cost of labor remains invisible until month-end reconciliation—when it's too late to adjust.
Scheduling Chaos and Missed Revenue Opportunities
Disconnected scheduling systems force office teams to juggle phone calls, texts, and calendar apps with no single source of truth. Double-bookings, delayed responses, and lost follow-ups become routine. When booking processes aren't optimized, high-value opportunities slip through because no one knows a lead came in, or a callback was never logged. Sales pipelines stall because tracking every deal manually is impossible at scale, and the team can't surface which opportunities deserve priority attention.
For businesses managing workflow automation, the absence of a dashboard means automation gains never translate into measurable performance improvements—teams automate tasks but still can't see the impact on revenue or efficiency.
End-to-End Visibility Gaps That Erode Margins
Without comprehensive operational visibility, protecting margins becomes reactive damage control rather than proactive strategy. Managers lack real-time insight into labor allocation, material costs, and project profitability across the portfolio. Accounting reconciliation happens in arrears, disconnected from field operations, so budget overruns and scope creep aren't caught until the project closes. The gap between what the estimate promised and what the job actually cost only becomes clear when it's too late to recover.
Projects don't fail because teams work poorly—they fail because no one sees the problem until the margin is gone.
When every stakeholder operates from a different version of the truth, accountability dissolves. Field teams don't know what office promised, office doesn't know what field delivered, and leadership can't answer the simplest question: are we making money on this job right now?
Solution Steps for Project Dashboard Setup
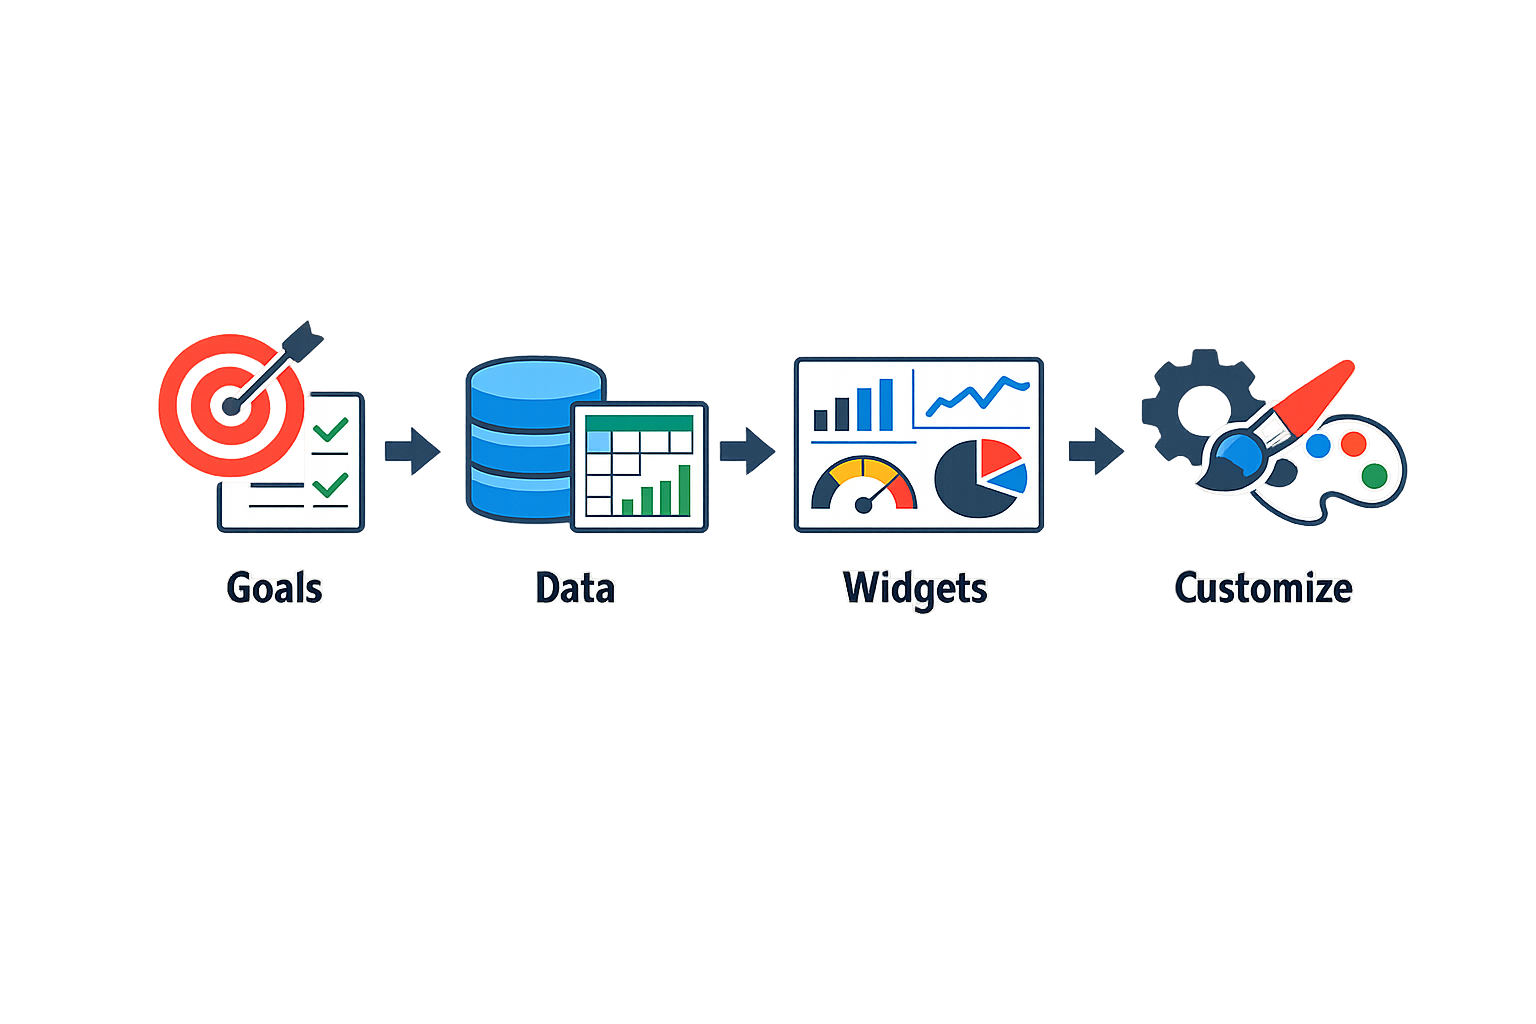
Building an effective project dashboard requires a structured approach that moves from intelligence gathering to active operation. The following steps break down the setup process into three distinct phases, each with specific deliverables that prepare your team to track what matters.
Phase One: Build the Intelligence Layer (Days 1–30)
The foundation of any Project Dashboard Setup starts with understanding what you're measuring and why. This phase establishes the technical baseline and identifies the metrics that will drive decision-making.
Step 1
Establish your technical baseline
Document your current state before you build anything. Catalog existing tools, data sources, reporting cadences, and stakeholder requirements. This inventory prevents duplication and reveals gaps that your dashboard must fill.
Step 2
Conduct a content inventory
Map every asset, project milestone, and data point your team generates. Identify which metrics are already tracked, which are scattered across tools, and which don't exist yet. This step surfaces the intelligence your dashboard will centralize.
Step 3
Create a search opportunity map
Define what questions your dashboard must answer. Prioritize metrics by impact: which numbers change behavior, which inform strategy, and which satisfy compliance. Your opportunity map becomes the blueprint for what gets tracked.
Step 4
Set an AI-visibility baseline
If your dashboard will feed into automated reporting or decision systems, establish how data flows between tools. Document integrations, API limits, and refresh intervals so your dashboard operates within technical constraints.
Phase Two: Improve Existing Assets (Days 31–60)
Once the intelligence layer is built, focus shifts to optimizing what you already have before adding new components.
Step 5
Refresh high-value pages and reports
Identify the metrics your team checks most often and improve their presentation. Simplify visualizations, add context to raw numbers, and remove noise that distracts from key trends.
Step 6
Fix structural gaps
Address missing data sources, broken integrations, and reporting delays. If a critical metric requires manual updates, automate it. If a dashboard widget loads slowly, optimize the query or cache the result.
Step 7
Enhance internal linking between metrics
Connect related data points so users can drill down from summary views to detailed breakdowns. A revenue metric should link to pipeline stages; a task completion rate should connect to individual assignments. Navigation determines whether your dashboard gets used or ignored.
Step 8
Launch your first optimization wave
Deploy the improved dashboard to a pilot group. Collect feedback on what's useful, what's missing, and what's confusing. Iterate quickly based on real usage patterns before rolling out to the full team.
For service businesses managing customer pipelines, the principles here mirror the structured approach in lead response time tracking, where visibility into key metrics directly impacts conversion rates.
Phase Three: Operate the Engine (Days 61–90)
The final phase transitions from setup to sustained operation, ensuring your dashboard remains current and actionable.
Step 9
Run the ongoing content engine
Schedule regular updates for metrics that change frequently. Automate data refreshes where possible, and assign ownership for manual updates. A stale dashboard is worse than no dashboard.
Step 10
Ensure production readiness
Test your dashboard under realistic conditions: multiple users, peak data loads, and edge cases. Confirm that performance remains acceptable and that visualizations render correctly across devices.
Step 11
Establish an executive reporting cadence
Define what gets escalated, when, and in what format. Your dashboard should feed summary reports for leadership without requiring them to navigate the full interface. Extract key insights on a predictable schedule.
Step 12
Create a conversion feedback loop
Track how dashboard usage influences decisions. If a metric never prompts action, remove it. If a trend consistently triggers strategy changes, make it more prominent. Your dashboard should evolve as your team's needs shift.
Tips and Tricks for Effective Dashboard Tracking
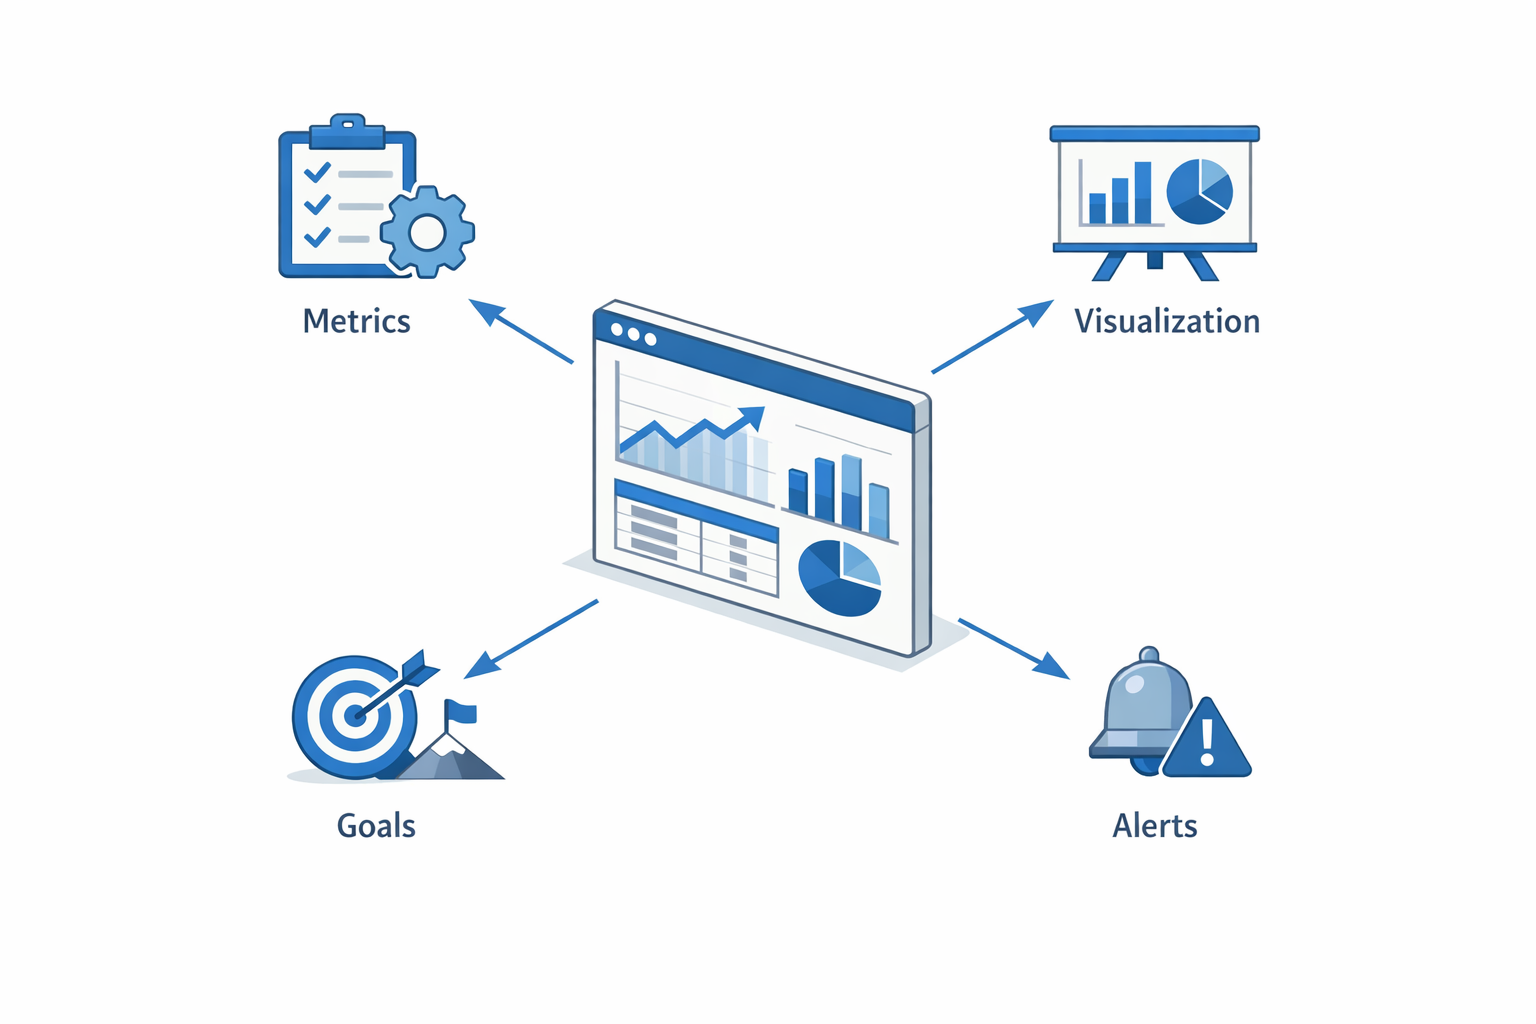
Building a dashboard is one thing — keeping it useful is another. The best dashboards evolve with your team's needs, stay focused on what drives decisions, and avoid the trap of tracking metrics that look impressive but don't inform action.
Start with Business Context, Not Features
Dashboards fail when they're built around what the tool can do rather than what the business needs to know. Before you add a widget, ask what decision it supports. A metric that doesn't change behavior is decoration. Start with the business context: what questions does your team ask daily, what thresholds trigger action, and what data connects visibility to pipeline outcomes. Features follow function — not the other way around.
Keep Sharing Options Simple and Consistent
Dashboards lose value when stakeholders can't access them quickly. Establish clear sharing workflows early: email snapshots on a fixed schedule, maintain a single permalink for live views, or export PDFs for offline review. Inconsistent access creates confusion and duplicate requests. Whether you're sharing invoice data, project status, or lead pipeline, the method should be predictable and require minimal explanation.
Integrate CRM Data for Follow-Up Accountability
A dashboard that tracks leads but doesn't connect to your CRM creates a gap between visibility and action. Incorporating CRM records — including lead status, customer history, and follow-up tasks — keeps project management organized and ensures nothing falls through the cracks. When abandoned quotes or unsigned proposals surface directly in the dashboard, follow-up becomes systematic rather than reactive. For service businesses especially, this integration turns a reporting tool into an operational system.
For teams managing client communication and proposal workflows, designing a quote request form that captures qualified jobs ensures the data entering your dashboard is already vetted and actionable.
The cheapest dashboard is the one your team actually opens every morning without being reminded.
Avoid Metric Overload
More data points don't equal better decisions. Dashboards cluttered with dozens of metrics train teams to ignore them. Limit your primary view to the handful of indicators that directly affect this week's priorities. Secondary metrics can live in drill-down views or archived reports. If a stakeholder needs to scroll to find their key number, the dashboard is too dense.
Build in Regular Review Cycles
Dashboards drift when no one owns their accuracy. Schedule monthly reviews to verify data sources, confirm metric definitions, and retire outdated KPIs. Treat the dashboard as a living document — what mattered in Q1 may not matter in Q3. Assign one person to maintain integrity and another to challenge relevance. Without this discipline, dashboards become stale reference materials rather than decision tools.
Conclusion
A well-designed Project Dashboard Setup transforms scattered data into a single source of truth that keeps teams aligned and projects on track. By choosing the right metrics—schedule adherence, budget variance, resource utilization, and quality indicators—you create visibility that drives better decisions at every level. The steps outlined above give you a repeatable framework: define objectives, select KPIs, choose the right tools, design for clarity, automate data flows, and refine through iteration.
The real value emerges when your dashboard becomes a daily habit rather than a reporting afterthought. Teams that capture time accurately and track labor costs in real time see immediate improvements in operational efficiency and margin protection. Automated scheduling and optimized workflows further enhance performance, freeing your team to focus on execution rather than data entry. Start with a focused set of metrics, build incrementally, and let user feedback guide your refinements.
Whether you're managing field crews, coordinating remote teams, or overseeing complex multi-phase projects, the principles remain the same: measure what matters, make it visible, and act on what you see. If you're looking to streamline operations beyond dashboards, explore workflow automation strategies that integrate seamlessly with your tracking systems. The best dashboard is the one your team actually uses—build it with their workflows in mind, and you'll see adoption and results follow naturally.
Learn how to set up a project dashboard, what key metrics to track, and how to build one that suits your team's needs.
Written by
Xenophon Giannis
Published November 9, 2026 · 11 min read
Xenophon Giannis is the founder and CEO of Xenco Labs, where he designs, builds, deploys and operates production AI software solo — on his own multi-node cluster, with his own LLM gateway and automation infrastructure. Twenty-five years in enterprise technology came first: a decade at AboveNet, hired as its first sales rep after bankruptcy and promoted until he ran the entire Western Pacific region, then sales leadership at Black Lotus and Nexusguard in DDoS mitigation. He writes about what he actually ships, and what actually breaks in production.
You Might Also Like
More from the Xenco Labs blog

Intranet Software with Project Management: Centralize Team Collaboration

Work Order Management Software: Streamline Service Requests
Discover how work order management software streamlines service requests and task assignments, improving efficiency and response times for your team.

MSP Software Buying Guide: Key Features for Managed Service Providers
Explore the MSP Software Buying Guide highlighting key features that matter for Managed Service Providers to streamline their operations.

How to Choose the Best Project Management Software
Learn how to choose the best project management software that fits your team's needs, boosts productivity, and streamlines collaboration effectively.